

Your monthly 3PL performance report shouldn’t feel like a confusing receipt for services you’ve already paid for. If you’re struggling to understand how to read a 3pl performance report without getting lost in complex WMS exports, you’re not alone. It often feels like there’s a total disconnect between the “green” numbers on the page and the reality of customer complaints about late deliveries. You know the data is there, but spotting hidden costs or operational friction feels like finding a needle in a haystack.
This guide will teach you to master the art of decoding data to identify bottlenecks and reduce costs for your Australian eCommerce business. We’ll show you how to compare your provider’s results against industry benchmarks, such as the 99% order accuracy standard, and how to hold them accountable when things slip. Our overview covers the specific metrics that indicate true operational health, from inventory accuracy to returns handling efficiency, so you can scale your brand with total confidence.
Key Takeaways
- Connect your warehouse data directly to your growth strategy by understanding the role of reporting transparency in a successful partnership.
- Master how to read a 3pl performance report to identify subtle “performance drift” and hold your provider accountable to their Service Level Agreements.
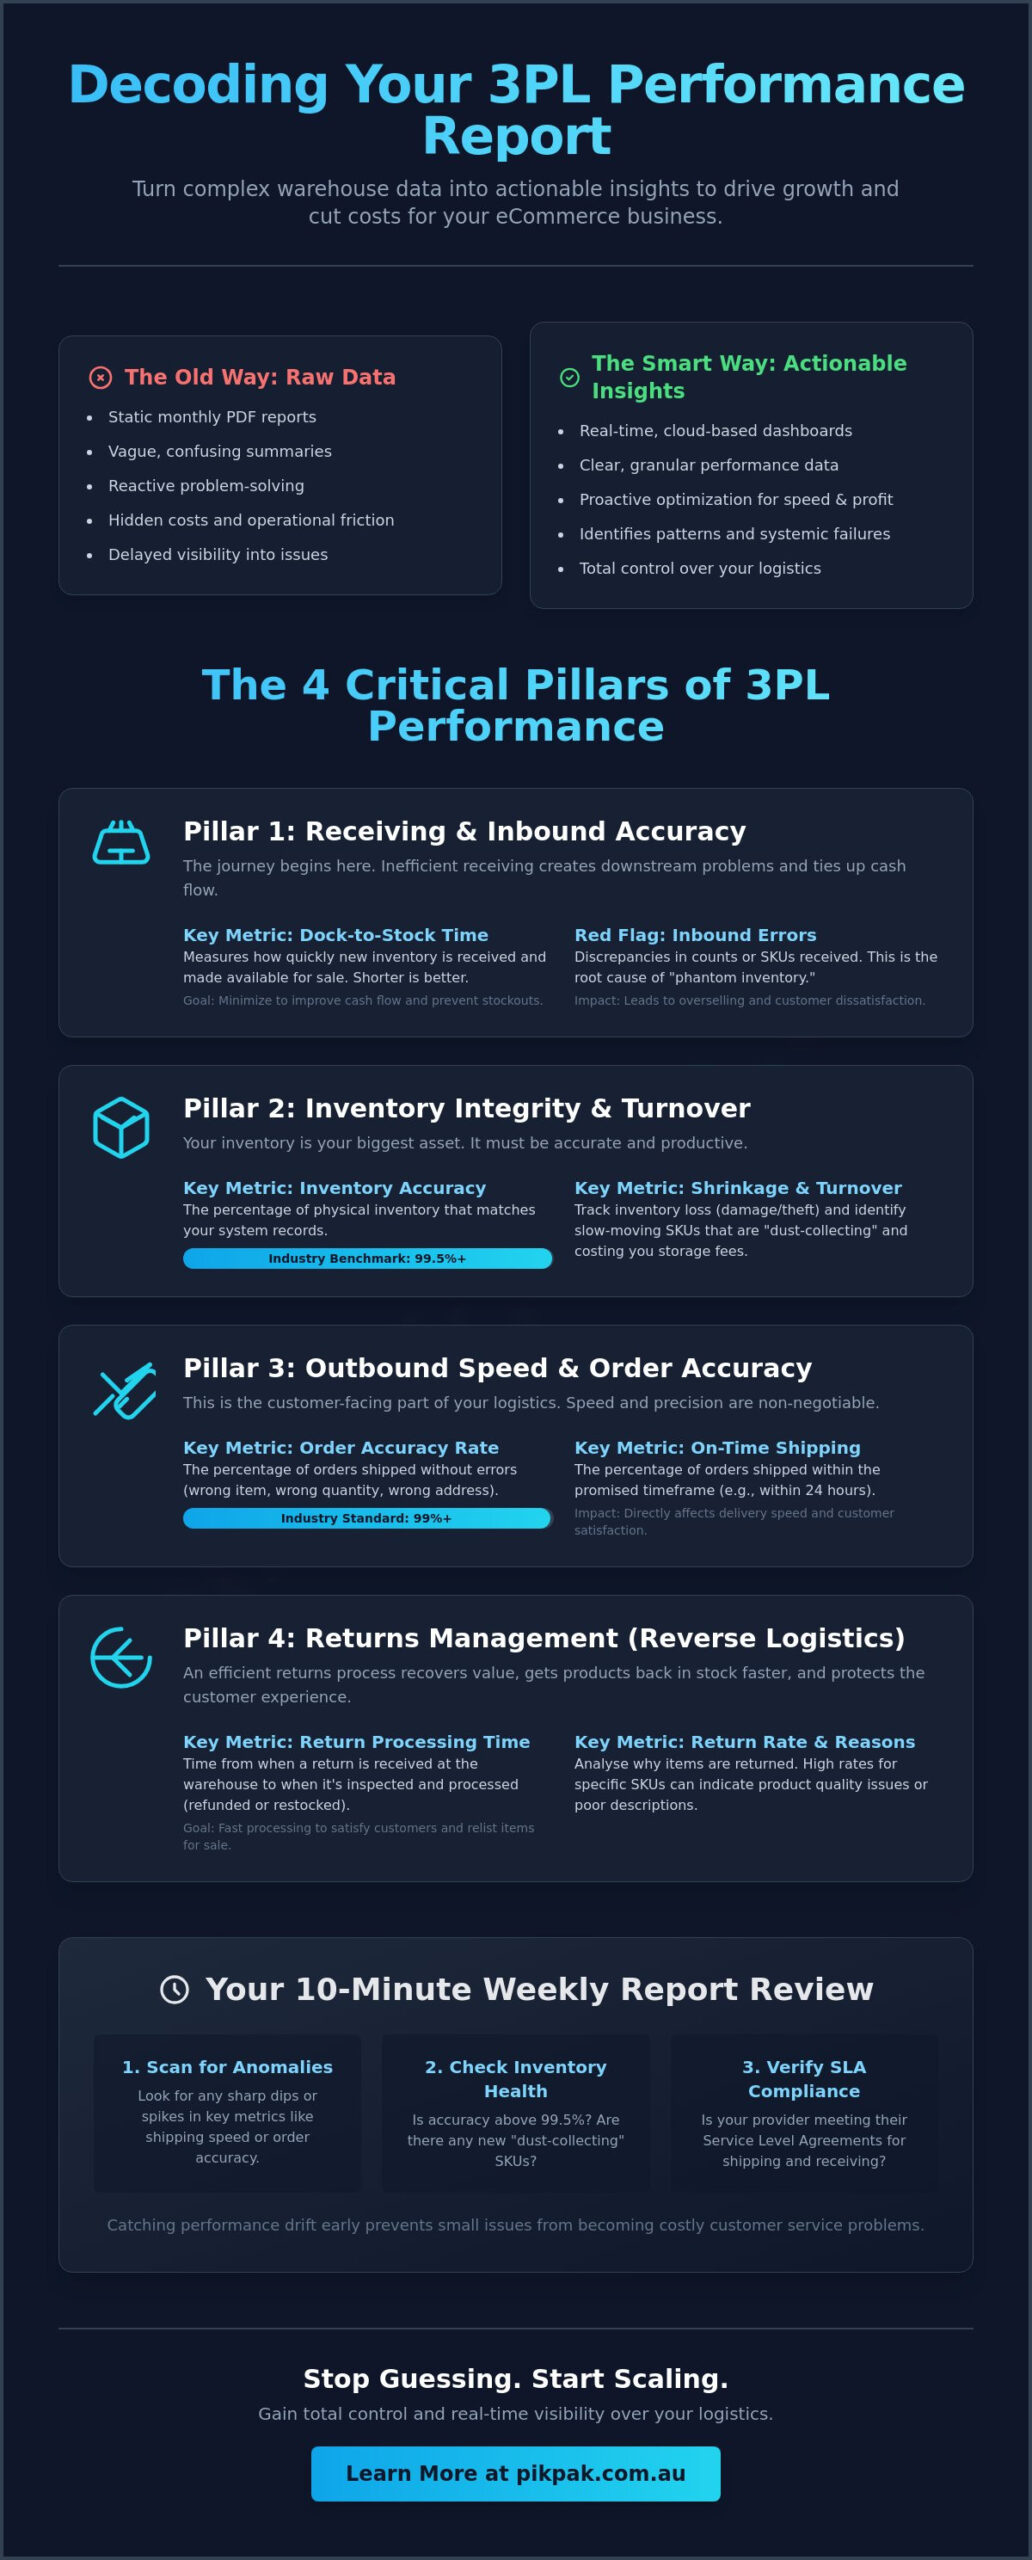
- Focus on the four critical pillars of logistics, including inbound accuracy and inventory health, to ensure your stock is always ready for sale.
- Implement a quick 10-minute review routine that helps you catch operational anomalies before they turn into expensive customer service issues.
- Learn how integrating your e-storefront with a transparent WMS platform simplifies complex logistics into manageable, actionable insights.
Decoding Your 3PL Performance Report: Why the Data Matters
Think of your logistics data as the pulse of your business. A monthly report isn’t just a receipt for services rendered; it’s the vital bridge between what happens on the warehouse floor and your high-level business strategy. When you master how to read a 3pl performance report, you stop guessing about your growth and start making decisions based on hard facts. You don’t need a degree in data science to do this effectively. You just need to know which numbers impact your bottom line and how to spot the trends that matter.
Transparency in reporting is the absolute foundation of a healthy partnership. If your logistics provider hides behind vague summaries, you can’t identify where your money is going or why customers are frustrated. A professional Third-party logistics (3PL) provider should offer clear, granular data that lets you see exactly how your stock is moving. This shift from reactive troubleshooting to proactive scaling is what separates stagnant brands from market leaders. Instead of fixing fires, you’re optimizing for speed and profit.
The Difference Between Raw Data and Actionable Insights
Why Real-Time Visibility Changes the Game
Waiting for a monthly PDF is a risky way to run a modern business. By the time you see a dip in performance in a static report, the damage to your brand reputation is already done. Real-time visibility through cloud-based dashboards allows you to spot “performance drift” as it happens. This technology prevents the dreaded Monday Morning surprise where you log in to find a backlog of unfulfilled weekend orders. With tools like Pik Pak Technology Support, you gain instant access to your operations. You can monitor stock levels and shipping speeds as they fluctuate, giving you total control over your logistics without ever stepping foot in a warehouse. It’s about having the right information at the right time to keep your customers happy and your margins healthy.
The 4 Critical Pillars of a 3PL Performance Report
A comprehensive report should do more than just list shipping costs. It needs to provide a 360-degree view of your supply chain through four distinct pillars. When learning how to read a 3pl performance report, you should look for data that covers inbound logistics, inventory management, outbound fulfilment, and returns. If any of these are missing, you’re only seeing half the picture. Each pillar represents a stage where efficiency can be gained or profit can be lost.
Pillar 1: Receiving and Inbound Accuracy
The journey of your product starts at the dock. “Dock-to-Stock” time measures how quickly your 3PL receives a shipment and makes it available for sale. This is a critical metric for cash flow. If your stock sits on a pallet for five days, that’s five days of lost revenue. Inbound errors are often the root cause of “phantom inventory” issues that plague eCommerce stores later. To keep these reports clean and accurate, it’s vital to follow established Warehouse Receiving Guidelines. This ensures your provider can count and store your items without delays or discrepancies.
Pillar 2: Inventory Integrity and Turnover
Inventory accuracy is the foundation of a reliable store. The industry benchmark for inventory accuracy is between 99.50% and 100%. Anything lower suggests a lack of control in the warehouse. You should also track “shrinkage,” which is the loss of inventory due to damage or theft. While some minor loss is expected in large operations, high shrinkage rates are a major red flag. Use your report to identify “dust-collecting” SKUs. If items aren’t turning over, they’re simply eating up your storage budget. Understanding how to read a 3pl performance report helps you make smarter purchasing decisions and reduces wasted spend.
Pillar 3: Outbound Speed and Order Accuracy
This is where the customer experience lives. Order pick accuracy is arguably your most important metric, with industry leaders aiming for 99.9%. Even a small dip here leads to expensive returns and unhappy reviews. Your report should also distinguish between “Time to Ship” (how fast the 3PL works) and “Time to Deliver” (how fast the carrier works). This distinction is essential for holding the right party accountable. For a deeper look at these processes, you can explore our guide on warehousing and fulfilment. High-performing logistics should feel effortless, allowing you to scale without the headache of manual tracking.
Pillar 4: Returns and Reverse Logistics
Finally, don’t overlook the data for returns and reverse logistics. This “hidden” pillar can quietly erode your margins if not managed efficiently. A professional report will show you how quickly returns are processed and returned to stock. According to industry standards, returns should be handled within 48 to 72 hours, though the ideal timeframe is 24 hours or less. Efficient returns management keeps your stock moving and your customers satisfied, even when a purchase doesn’t work out.
By focusing on these core areas, you can turn a boring spreadsheet into a strategic roadmap for growth. If you’re ready to see how transparent data can transform your business, consider how our tailored logistics services can provide the clarity you need.
How to Spot Red Flags and Performance Drift
Performance drift is the silent killer of eCommerce growth. It’s rarely a sudden warehouse catastrophe; instead, it’s a slow, steady decline in shipping speed or a creeping error rate that goes unnoticed for months. Knowing how to read a 3pl performance report means looking for these subtle shifts before they damage your brand reputation. You need to compare your monthly data against your Service Level Agreement (SLA) to ensure your provider is actually delivering on their promises. If your SLA guarantees 99% accuracy but your report shows 97%, that’s a significant breach that leads to increased reship costs and frustrated customers.
You might find yourself in a situation where the report looks perfect, yet your customer service inbox is overflowing with complaints. This “accuracy paradox” often happens when a 3PL measures internal pick accuracy rather than delivered accuracy. To find the truth, look for hidden red flags like rising reship rates or returns that seem to stall in the “received” phase for days. These anomalies suggest that while the warehouse thinks they’re doing a great job, the reality for your customer is very different. Identifying these gaps allows you to have a data-backed conversation with your provider rather than relying on gut feelings.
Establishing Your Performance Baseline
To spot drift, you first need to know what “normal” looks like. We recommend looking at three to six months of historical data to establish a solid baseline for your operations. Keep in mind that seasonal peaks, such as Black Friday or the Christmas rush, will naturally shift your expectations. During these high-volume periods, a slight dip in speed might be acceptable, provided it was planned for in advance. Standard deviation in the context of transit times measures the consistency of your deliveries, indicating whether your shipping speed is reliably stable or wildly unpredictable. If your standard deviation is high, your customers can’t trust your delivery estimates.
Common 3PL “Vanity Metrics” to Watch Out For
Not all data is created equal, and some metrics are designed to make a 3PL look better than they are. One of the most common traps is the “Label Created” metric. A label can be printed on Monday, but if the package isn’t scanned by the carrier until Wednesday, your customer experiences a two-day delay that doesn’t show up as a 3PL error. Always look for “Carrier Scanned” or “Manifested” timestamps to get the real story. Similarly, “Total Orders Processed” is a vanity metric that means very little without a corresponding accuracy percentage. Finally, watch out for “averaging out.” A 3PL might use one exceptionally fast week to hide a disastrously slow one, masking a systemic issue with a high monthly average. Understanding how to read a 3pl performance report helps you see past these distractions and focus on the metrics that actually drive your growth.
From Data to Action: How to Review Reports with Your Provider
Having the data is only half the battle. The real value comes from what you do with that information. Once you understand how to read a 3pl performance report, you need a consistent process to turn those numbers into better results. This isn’t about micromanaging every single parcel. It’s about establishing a rhythm that ensures your logistics partner stays aligned with your business goals. By shifting the conversation from “blame” to “collaborative problem-solving,” you build a partnership that can actually scale.
We recommend a simple “Monday Morning” routine. It should take no more than 10 minutes to scan for anomalies. Look for spikes in shipping times or dips in accuracy that happened over the weekend. If you spot a trend, address it immediately rather than waiting for the end of the month. This proactive approach keeps small issues from snowballing into major customer service crises. Use this data as leverage during your Quarterly Business Review (QBR) to negotiate better rates or service improvements. When you come to the table with hard evidence, you’re no longer just asking for a favour; you’re discussing a business case for efficiency.
The 3-Question Framework for Every Report
To make your reviews more efficient, run every report through these three questions. It keeps the meeting focused and actionable:
- Where did we deviate from the SLA this week? Identify the specific metric that missed the mark, whether it’s dock-to-stock time or pick accuracy.
- Is this a one-off error or a process failure? A single mispacked box is a human error; a three-day delay in receiving every inbound shipment is a process failure that needs a fix.
- What is the cost impact of this specific metric? Calculate the real dollar value of these errors, including reshipment fees and lost customer lifetime value.
Collaborating on Special Projects and Kitting
Reports are also your best tool for measuring the success of promotional events. If you’re running bundles or limited-edition kits, use your data to track how these special projects affect warehouse throughput. You can use this data to justify the cost of Kitting & Assembly services by comparing the labour savings against the increase in average order value. Set separate KPIs for these special projects so they don’t skew your standard order data. This allows you to experiment with new marketing strategies without losing sight of your core operational health. How to read a 3pl performance report effectively means knowing which data points belong to which project.
If you’re tired of guessing and want a partner that provides clear, actionable insights every time, contact us today to see how we can streamline your logistics.
Effortless Logistics: How Pik Pak Simplifies Performance Reporting
Pik Pak isn’t just a warehouse. We’re your strategic growth partner. We believe that “Effortless eCommerce” starts with total transparency. When you’re learning how to read a 3pl performance report, you shouldn’t have to fight with clunky spreadsheets or outdated PDFs. Our approach is built on providing the clarity you need to make fast, confident decisions. By automating the data flow between your e-storefront and our warehouse, we remove the friction that usually slows down scaling businesses. You get the insights you need without the manual labour.
Our Australian expertise means we understand the local landscape. We provide accurate transit data for domestic deliveries, ensuring your customer expectations match the reality of the Australian courier network. This precision allows you to reclaim your time. Instead of digging through data to find errors, you can focus on your core objectives while we handle the heavy lifting. It’s about moving from operational stress to strategic control.
Real-Time Visibility via the Pik Pak WMS
Our web-based WMS platform is the “one source of truth” for your entire operation. It eliminates the need for manual data entry and risky spreadsheets that can quickly become outdated. You can see your inventory levels, order statuses, and shipping speeds in real-time from any device. This live visibility ensures you’re never caught off guard by a stockout or a shipping delay. For businesses with more complex needs, our API access allows your team to build custom reports that fit your specific workflow. It’s about giving you total visibility without the operational headache.
A Partnership Built on Accountability
We don’t just provide data; we provide a commitment. Our focus on Service Priorities means we hold ourselves to the highest standards every single day. We view reporting as a growth tool, not just a monthly check-in. When you understand how to read a 3pl performance report through our transparent dashboard, you’ll see exactly how we meet our SLAs and where we’re helping you improve your margins. We invite you to experience a partnership where accountability is the default setting. We don’t hide behind complex jargon; we show you the results in plain English.
If you’re ready to stop stressing over logistics and start scaling with precision, we’re here to help. Request a quote from Pik Pak Logistics today and see how our transparent reporting can drive your success.
Take Control of Your eCommerce Growth Through Data
Mastering how to read a 3pl performance report isn’t just about tracking parcels; it’s about gaining the clarity needed to scale your business without the operational friction. You now have the tools to look past vanity metrics, identify subtle performance drift, and turn raw data into a strategic roadmap. By focusing on the four critical pillars of logistics, you can ensure every order strengthens your customer relationships rather than draining your resources.
Logistics should be an enabling force for your brand, not a constant source of stress. With state-of-the-art Australian warehouse facilities and seamless eCommerce integrations, Pik Pak provides the infrastructure you need to succeed. Our real-time WMS visibility ensures you always have a single source of truth for your inventory and orders. It’s time to stop second-guessing your supply chain and start making data-backed decisions with total confidence.
Ready for transparent, effortless logistics? Get a quote from Pik Pak today.
You’ve done the hard work of building your brand. Now, let a partner handle the heavy lifting so you can reclaim your time and focus on your next big objective.
Frequently Asked Questions
What is a “good” order accuracy rate for a 3PL?
A good order accuracy rate should fall between 99.00% and 100%. High performing providers often target a specific accuracy of 99.9% to minimize customer service friction and reshipment costs. If your provider consistently drops below the 99% threshold, it indicates systemic issues in the picking and packing process that need immediate attention to protect your brand reputation.
How often should I receive a performance report from my 3PL?
You should have real-time access to your data through a cloud-based dashboard, but a formal performance summary should be reviewed monthly. Monthly reports allow you to spot long-term trends and “performance drift” that might be missed in daily checks. This regular cadence ensures you can hold your provider accountable and make informed decisions about your inventory levels and shipping strategies.
What is the difference between “dock-to-stock” and “order cycle time”?
Dock-to-stock measures the time it takes for your inbound inventory to be received and made available for sale on your website. Order cycle time tracks the speed from the moment a customer places an order to when it actually leaves the warehouse. Both metrics are vital for cash flow and customer satisfaction. Learning how to read a 3pl performance report involves balancing these two distinct phases of the supply chain.
Why does my 3PL report different shipping times than my customers report?
This discrepancy usually happens because the 3PL measures the time until a package is ready for pickup, while customers measure the total time until it arrives at their door. Your report might show a fast “time to ship,” but carrier delays or missed scans can extend the “time to deliver.” Always check the “Carrier Scanned” timestamp to see when the parcel officially left the warehouse’s control.
What should I do if my 3PL consistently misses their SLA targets?
Schedule a formal review meeting to discuss the data and identify if the misses are one-off errors or process failures. Use your performance reports to document the trend and ask for a written remediation plan with specific deadlines for improvement. If the provider cannot meet the agreed standards after this intervention, it may be time to consider a partner that prioritizes accountability and transparency.
Can I integrate my Shopify or WooCommerce data directly into a 3PL report?
Yes, modern logistics providers offer seamless integrations that sync your Shopify or WooCommerce store directly with their WMS platform. This connection ensures that order data and inventory levels flow automatically between your storefront and the warehouse. This integration eliminates the need for manual spreadsheets and ensures your reports are based on a single source of truth for all your sales channels.
What is “inventory shrinkage” and what is an acceptable limit?
Inventory shrinkage is the loss of stock due to damage, theft, or administrative errors in the warehouse. The industry benchmark for inventory accuracy is between 99.50% and 100%, which means shrinkage should stay well below 0.5%. If your report shows shrinkage exceeding this limit, it suggests poor inventory management or security issues that are directly eating into your profit margins.
How do I calculate the cost per unit shipped from my report?
To find this figure, divide your total fulfillment invoice for the month by the total number of units shipped during that period. This calculation should include receiving, storage, pick and pack, and shipping fees to give you a true cost per unit. Tracking this metric is a critical part of knowing how to read a 3pl performance report effectively to protect your eCommerce margins as you scale.